Food production owners are usually anxious about their production aims and the steps that need to be taken for continuous improvement and profit. Food facilities need to engage in different techniques and ways to enhance their business productivity.
Dr. Kaoru Ishikawa from Japan introduced innovative tools for the business community. 7 QC tools are a simple statistical set of tools that provide you with ease to solve problems related to your work quality.
The following are the 7 QC tools to consider for your food business.
 7 QC tools
- Pareto diagram
- Cause and Effect Diagram
- Histogram
- Control charts
- Scatter diagrams
- Check sheets
- Flow charts
Pareto Diagram
The first QC tool is a combination of both bar and line graphs known as Pareto Diagrams. Using this tool, food industrialists can identify the biggest contributor that improves the production of the food facility.
The two products will be mentioned on the x-axis, and their sales will be on the y-axis. The cumulative percentage will be on the right side of the diagram. A line is drawn from the topmost bar and dragging it till the end of percentage.
- This will give an idea to a food industrialist how much a specific product is being sold out from the overall production of the food industry
- Through this diagram, workers can easily see the defects present in any food product due to any minor or major occurrence. One can then easily identify and adopt the measures that need to be taken to boost the performance of Food facilities
- This will enable prioritization of issues in food productivity
Cause and Effect Diagram
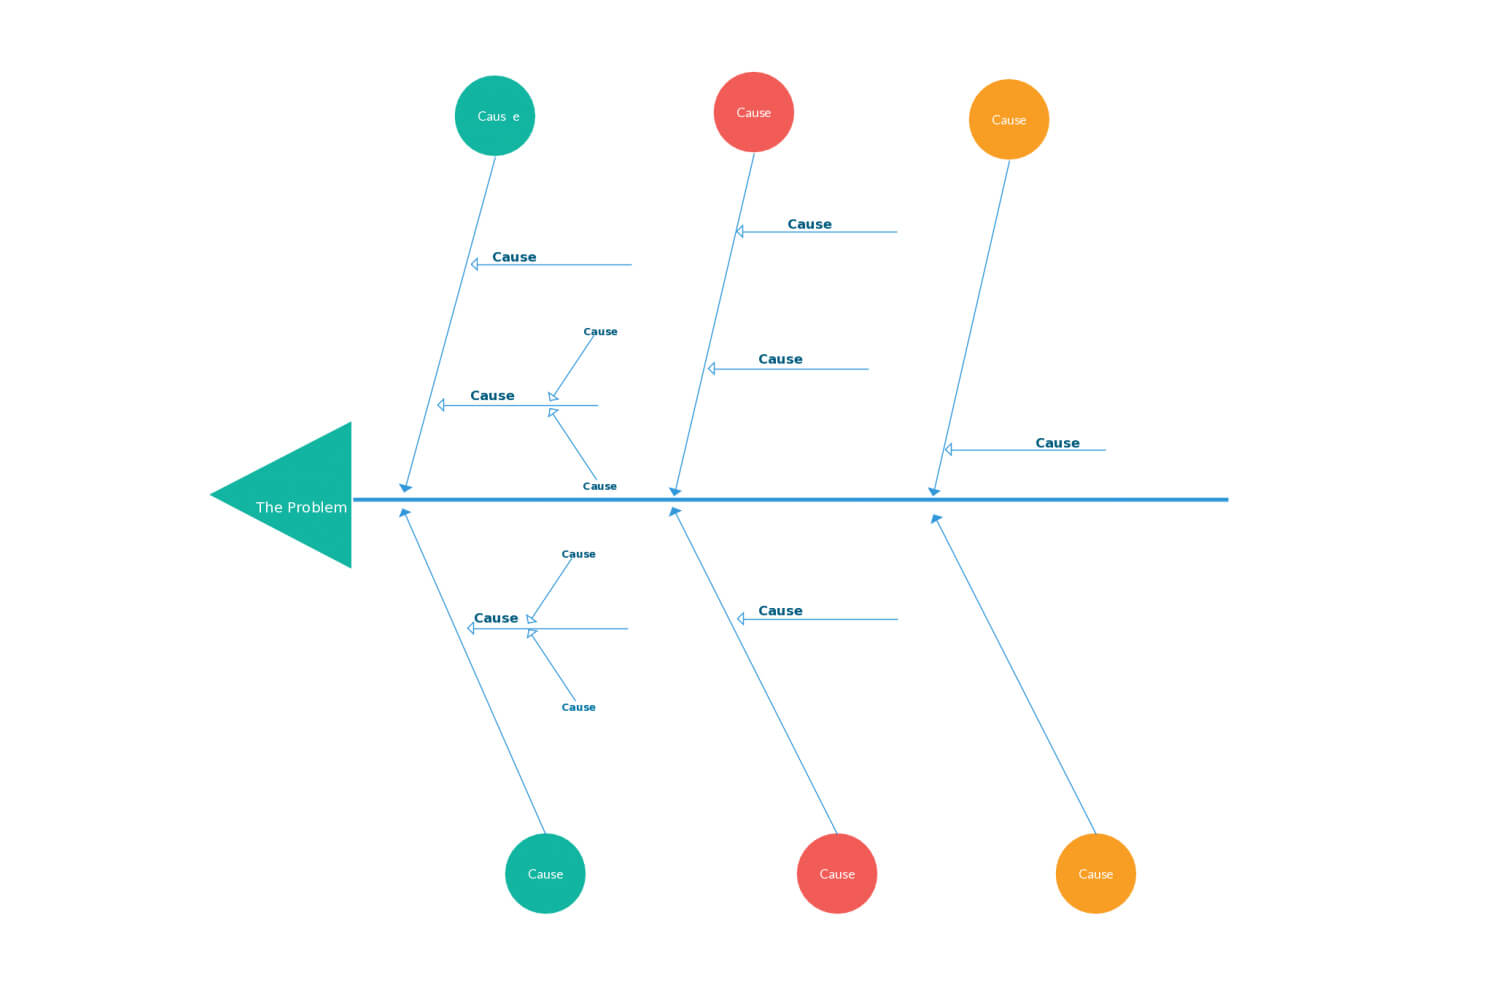
The second tool is known as the Fish-Bone Diagram. Cause and effect Diagram is a tool to identify the principal reason for the problem that needs to be sorted out.
One can understand this diagram by taking an example of a food product. The analysers can use this tool by first identifying the main problem in productivity. Then make a fish layout with the head and spine part.
Write down the issue that needs to be resolved in the head part. Food industry professionals need to think about the possible causes of this issue and mention them on the spine part of the diagram. Also, professionals can categorize the reasons for groups to make it easy. It helps to develop a list of potential sources that creates a certain problem and ends up lowering the facility’s production.
- Allows resolution of the issues one at a time
- Enables to improve productivity effectively
- Allows development of an improvement plan for the major concerns
- Contributes to hassle-free production hy helping in figuring out the main cause of the issue
Histogram
Another tool is the histogram, which is a graphical representation in the form of continuous bars. Suppose food industries have a new food product to manage and get issues regarding it. Then, it requires collection of at least 50 to 75 data values to construct a histogram. The histogram helps to locate, spread, and shape the data. This bar graph shows the frequency of the values.
Draw the bars without any space and identify the topmost peak in the graph. It will show the major cause to improve food product quality.
- Enable to observe variations in the form of bars
- Continuous data also represents the trends and patterns in the quality of the product
Control Charts
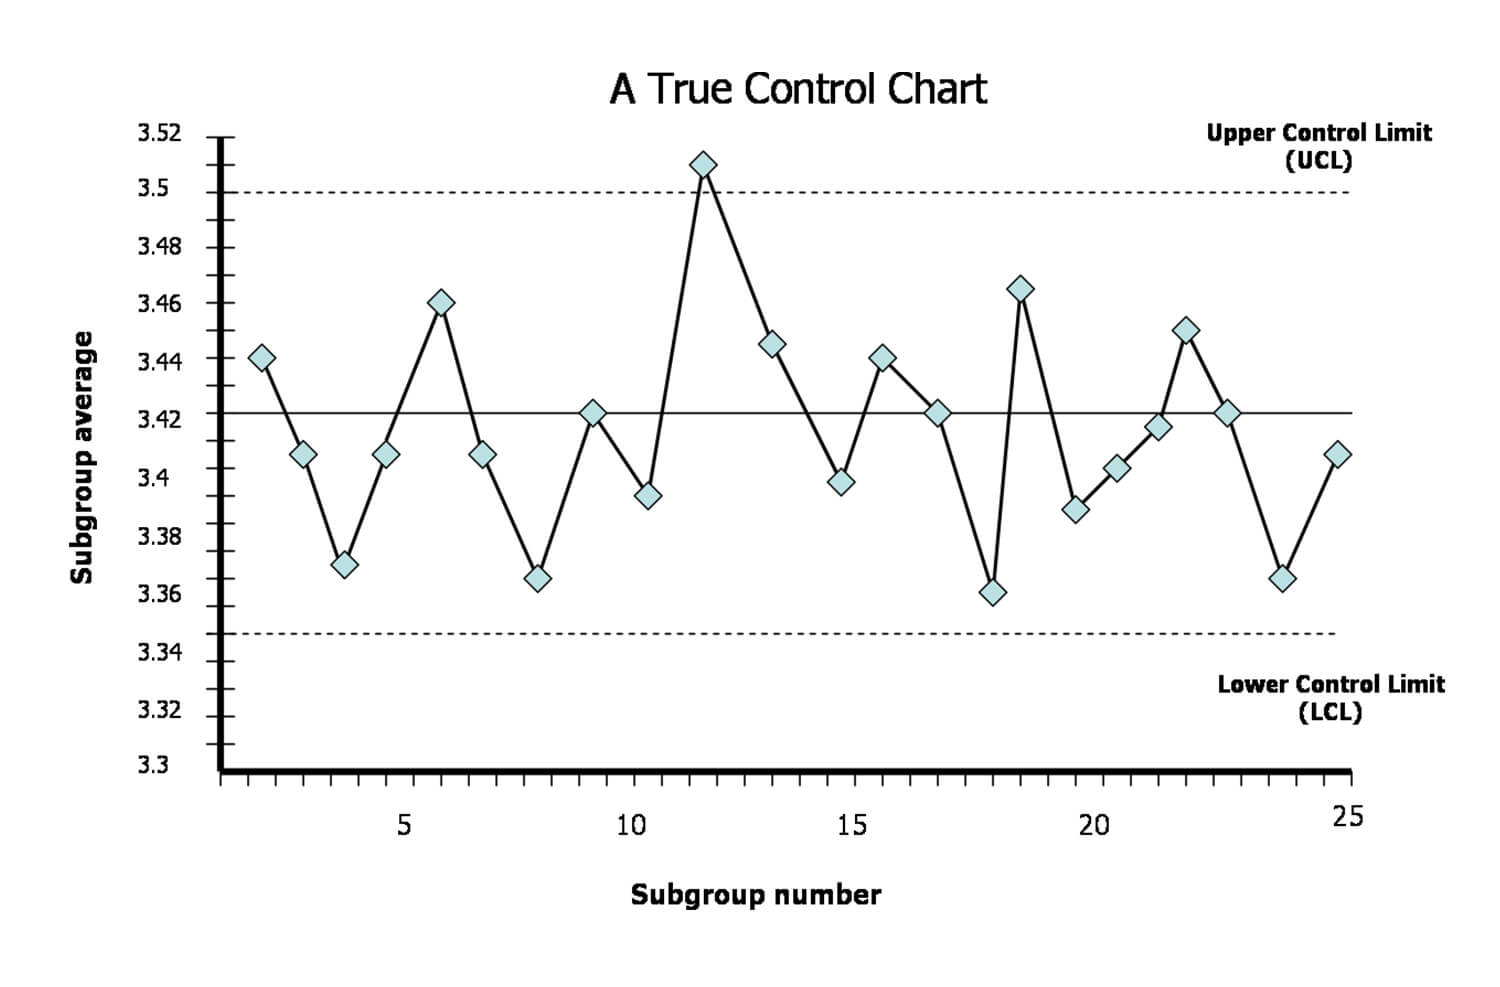 The fourth tool is recommended to know whether the food production is of good quality or not. The owner makes specific changes to improve his business, and this leads to modifications in productivity. Professionals can determine the improvement dynamics by using control charts. It is the most effective tool that helps to investigate different variations in the production process of food.
Collect the data and divide it into two subgroups. Mark the values in the graph for both groups and calculate the mean for the benefits first. Now calculate the average between the lines of the two subgroups. The line in the center represents the average output of productivity.
- It determines the stability of production
- This chart shows whether the changes were valid or not
- Professionals can make an improvement plan after checking the average output
Scatter Diagrams
A Scatter diagram or chart is used to improve the quality of production. This tool gives an idea of the correlation between the two variables. It analyzes and visualizes the cause for the issue and determines the effects on the quality of the food produced.
- Highlights the influence of independent variables on dependent ones.
- It will help make a good improvement plan as one can see the causes and their effects on the same tool.
Check Sheets
Check sheets are the easiest tool among the 7QC tools. It is a statistical method to represent the data, both quantitative and qualitative wise. Professionals need to collect the data and arrange it in columns and rows, just like a table. These sheets show a summary or depict a tally count of the events in the food production facility.
- It is the best way to analyze the distribution process and mark down the steps of the production
- Professionals can make a checklist to identify occurrences of any defects and have an overview of the business improvements
Flow Charts
Furthermore, Flow charts are the most popular and useful tool for business growth. It is recommended to use flowcharts for planning the events, processes, or an outline about the making of a product.
They give an idea about the product, and it’s quality stepwise. It requires all the information about the steps before mapping down flow chart. It provides a representation of how workers’ activities or the food production process occur and what sequence.
- It is a simple way to list down the complicated procedures in the form of flowcharts with arrows’ help
- It gives the starting and the endpoint of any activity
Conclusion
It can be understood clearly that 7QC tools are a way forward to succeed in the productivity.
These tools make it easy for a professional to improve the quality of the work. Ultimately leading to achieve milestones and improving continuously for betterment under the umbrella of “Continuous Improvement “principle of Quality management system.
